This is a blog written by people who work at Datawrapper. We love charts, and we created this place to talk about them. Learn more.
Here you’ll find the latest Datawrapper features, Data Vis Dispatches, Weekly Charts, Data Vis Do’s & Dont’s, Maps, Opinions, information about Color in Data Vis, How to deal with data, the Data Vis Book Club, and more.
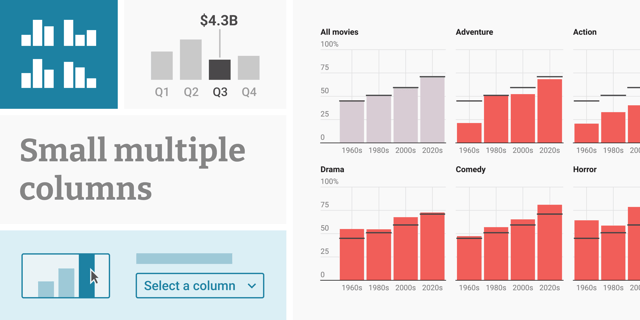
New: Small multiple column charts in Datawrapper
Latest Datawrapper News
Our latest big features that you can find in the Datawrapper app.

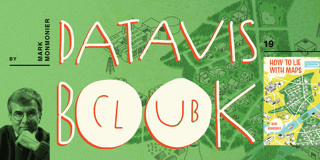
Data Vis Book Club
Join our written events to discuss data vis books with their authors.
Data Vis Dispatch
The best of last week’s big and small data visualizations.

Latest Weekly Charts
Every week, one of us builds a chart, map, or table with Datawrapper.
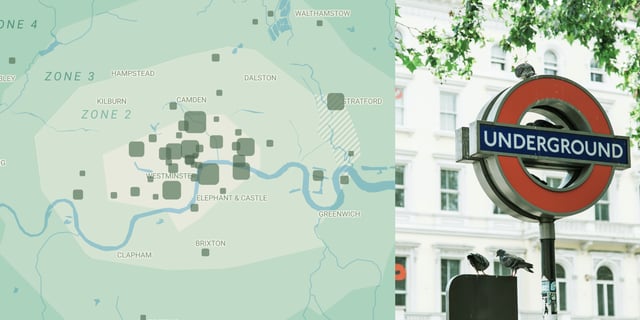
Mind the gap, scale the map (markers)


Data Vis Do’s & Don’ts
What to keep in mind when creating your next data visualization.
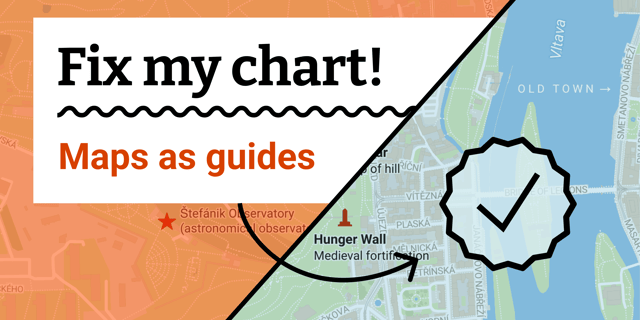
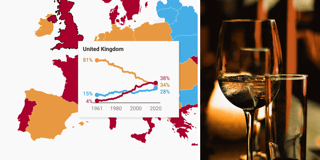
Fix my chart » Maps as guides


How people use us
Guest posts, customer stories and articles about visualizations by users.

How to deal with data
Tips for people who want to prepare data for simple charts, and how-tos for advanced needs.